
Press the button and be introduced to a new random company!

Introduce me >

Social media

facebook   Follow us on Twitter

Coverage

ES Group AB

ES Group AB

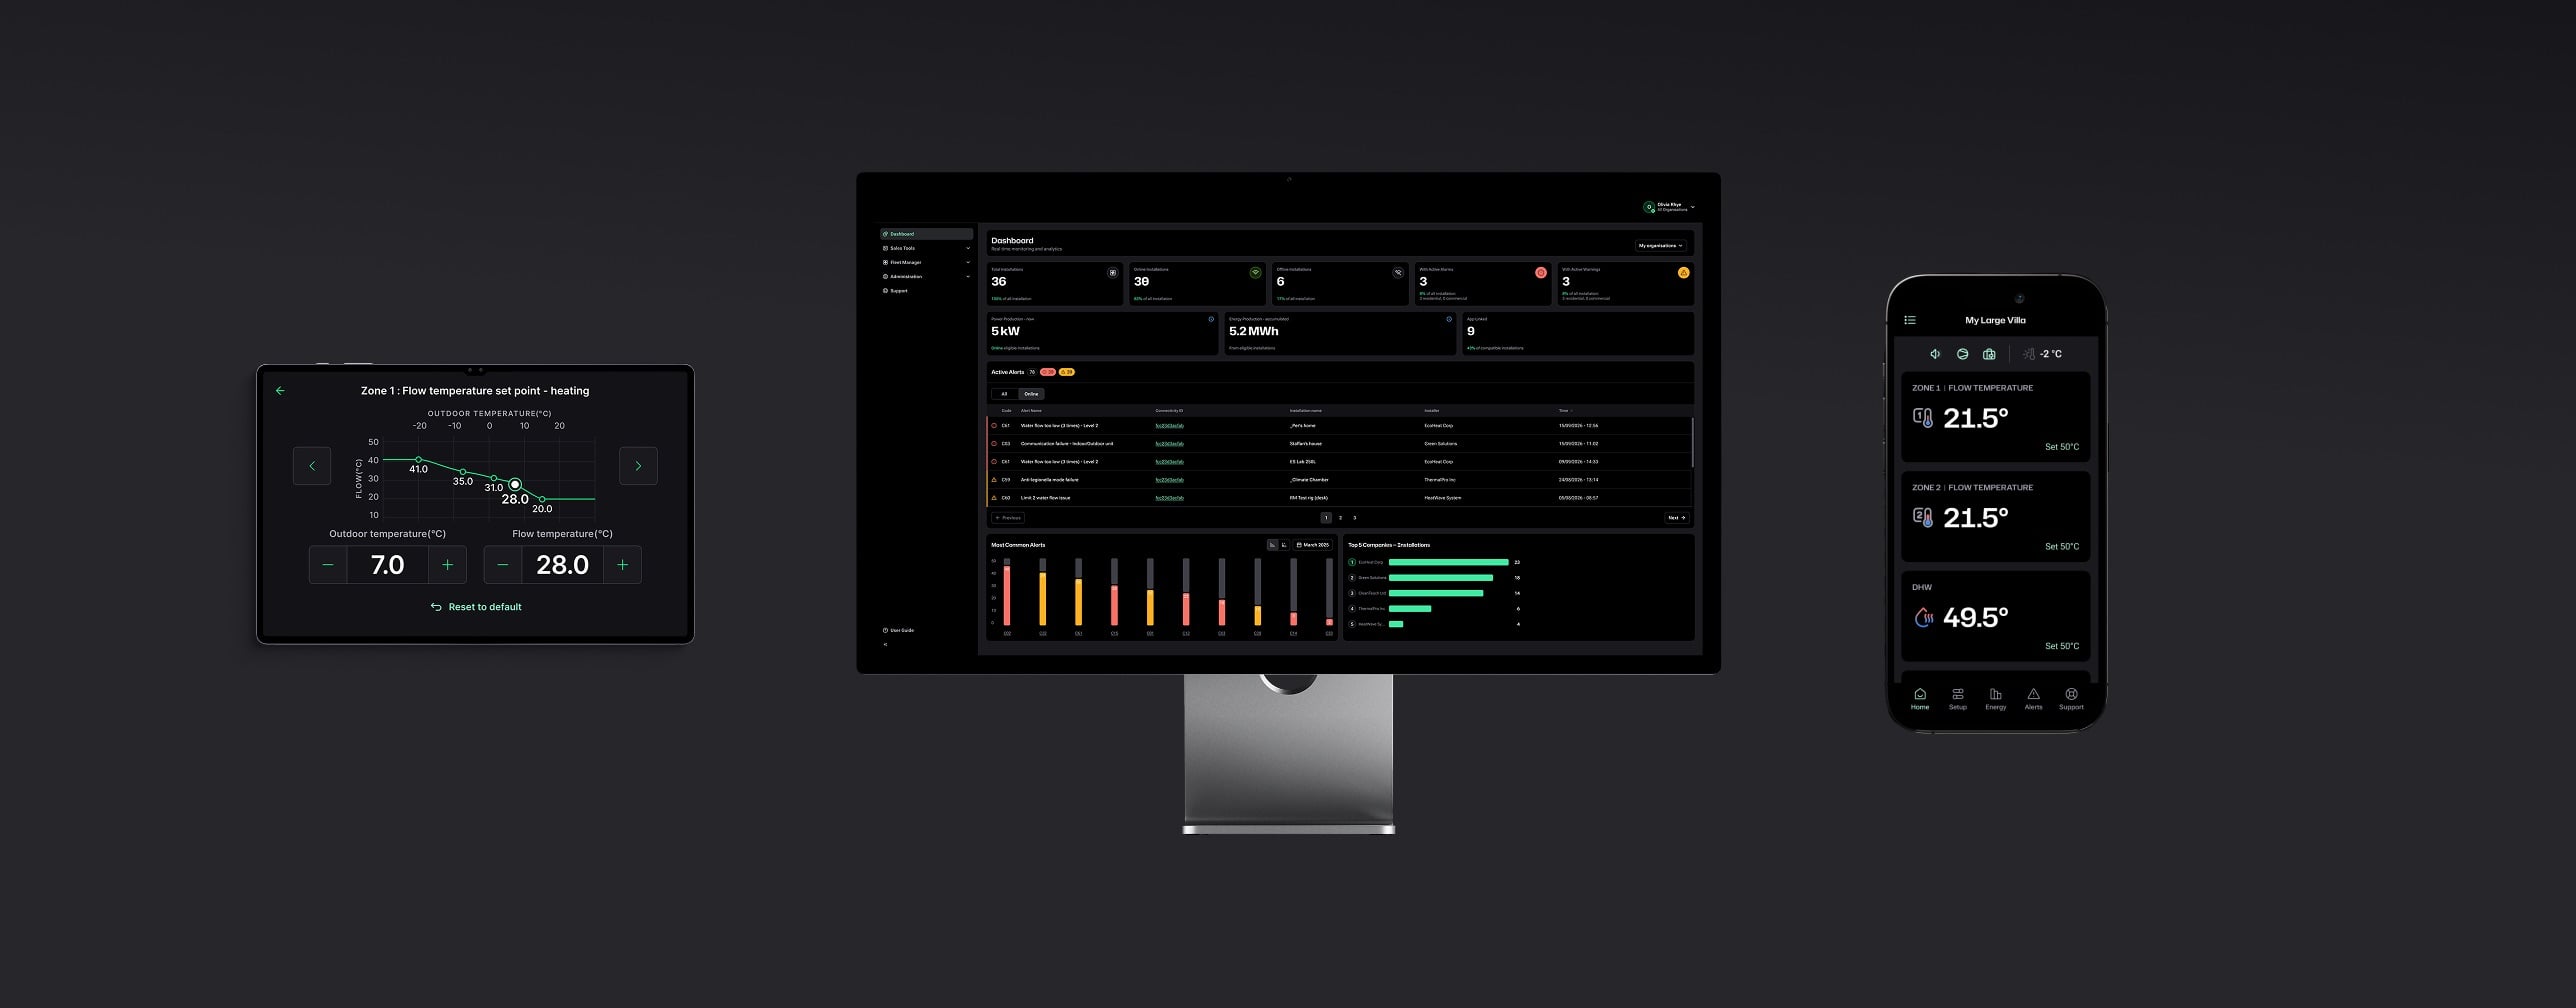
ES Group (formerly Energy Save) is a Swedish heat pump technology and platform company built on in-house R&D and outsourced production. It sells as ODM white-label to OEM partners and under its own ES Energy Save brand through distributors, targeting above-market growth and a 15% operating margin over the cycle. Residential is ~90% of sales and commercial ~10%, with the new propane (R290) platform, now spanning both, expected by management to support growth. The gross margin sits around 30%, though group EBIT has been negative through the recent demand trough.

Slow uptick in heat pump demand and lack of transition from fossil-fuelled heating, lower-than-expected margin support from higher volumes, Aira partnership not being extended, continued negative cash flow generation unless volumes improve.
SEKm 2025 2026e 2027e
Sales 186 201 217
Sales growth (%) -24,4 8 8,1
EBITDA -14 13 3
EBITDA margin (%) -7,7 6,6 1,5
EBIT adj. -22 0 -8
EBIT adj. margin (%) -11,9 0,1 -3,6
Pretax profit -23 -1 -8
EPS -3,47 -0,07 -1,18
EPS growth (%) 60,7 -98 N/A
EPS adj. -3,47 -0,07 -1,18
DPS 0 0 0
EV/EBITDA (x) -7,2 5,8 28
EV/EBIT adj. (x) -4,6 373,1 -11,6
P/E (x) N/A N/A N/A
P/E adj. (x) N/A N/A N/A
EV/sales (x) 0,55 0,38 0,42
FCF yield (%) -32,1 16,9 -12,1
Le. adj. FCF yld. (%) -32,1 16,9 -12,1
Dividend yield (%) 0 0 0
Net IB debt/EBITDA (x) -0,1 -2,5 -6,3
Le. adj. ND/EBITDA (x) -0,1 -2,5 -6,3
SEKm 2025 2026e 2027e
Sales 186 201 217
COGS -123 -115 -139
Gross profit 63 86 78
Other operating items -77 -73 -75
EBITDA -14 13 3
Depreciation and amortisation -8 -13 -11
of which leasing depreciation 0 0 0
EBITA -22 0 -8
EO Items N/A N/A N/A
Impairment and PPA amortisation 0 0 0
EBIT -22 0 -8
Net financial items -1 -1 -1
Pretax profit -23 -1 -8
Tax 0 0 0
Net profit -23 -1 -8
Minority interest 0 0 0
Net profit discontinued N/A N/A N/A
Net profit to shareholders -23 -1 -8
EPS -3,47 -0,07 -1,18
EPS adj. -3,47 -0,07 -1,18
Total extraordinary items after tax 0 0 0
Leasing payments 0 0 0
Tax rate (%) 0 0 0
Gross margin (%) 33,7 42,8 36
EBITDA margin (%) -7,7 6,6 1,5
EBITA margin (%) -11,9 0,1 -3,6
EBIT margin (%) -11,9 0,1 -3,6
Pre-tax margin (%) -12,3 -0,3 -3,9
Net margin (%) -12,3 -0,3 -3,9
Sales growth (%) -24,4 8 8,1
EBITDA growth (%) 48,2 -193 -75,8
EBITA growth (%) 39,4 -100,9 -3877,9
EBIT growth (%) 39,4 -100,9 -3877,9
Net profit growth (%) 60,7 -97,8 1556,8
EPS growth (%) 60,7 -98 N/A
Profitability N/A N/A N/A
Year N/A N/A N/A
ROE (%) -13,5 -0,3 -5
ROE adj. (%) -13,5 -0,3 -5
ROCE (%) -11,6 0,1 -4,1
ROCE adj. (%) -11,6 0,1 -4,1
ROIC (%) -14,5 0,1 -5,5
ROIC adj. (%) -14,5 0,1 -5,5
Adj. earnings numbers N/A N/A N/A
EBITDA adj. -14 13 3
EBITDA adj. margin (%) -7,7 6,6 1,5
EBITDA lease adj. -14 13 3
EBITDA lease adj. margin (%) -7,7 6,6 1,5
EBITA adj. -22 0 -8
EBITA adj. margin (%) -11,9 0,1 -3,6
EBIT adj. -22 0 -8
EBIT adj. margin (%) -11,9 0,1 -3,6
Pretax profit Adj. -23 -1 -8
Net profit Adj. -23 -1 -8
Net profit to shareholders adj. -23 -1 -8
Net adj. margin (%) -12,3 -0,3 -3,9
SEKm 2025 2026e 2027e
Goodwill 0 0 0
EBITDA -14 13 3
Other intangible assets 46 45 44
Net financial items -1 -1 -1
Tangible fixed assets 4 4 6
Paid tax 0 0 0
Right-of-use asset N/A N/A N/A
Non-cash items 0 0 0
Total other fixed assets 24 24 24
Cash flow before change in WC -15 13 3
Fixed assets 74 73 74
Change in working capital 0 18 -4
Inventories 84 64 76
Operating cash flow -15 31 -1
Receivables 35 34 28
Capex tangible fixed assets 0 0 -2
Other current assets 6 8 7
Capex intangible fixed assets -14 -12 -10
Cash and liquid assets 23 54 41
Acquisitions and Disposals -4 0 0
Total assets 223 234 226
Free cash flow -33 19 -13
Shareholders equity 157 173 165
Dividend paid 0 0 0
Minority 0 0 0
Share issues and buybacks 0 17 0
Total equity 157 173 165
Leasing liability amortisation N/A N/A N/A
Long-term debt 2 2 2
Other non-cash items 10 0 0
Pension debt N/A N/A N/A
Convertible debt N/A N/A N/A
Leasing liability 0 0 0
Total other long-term liabilities 2 2 2
Short-term debt 23 19 19
Accounts payable 19 21 20
Other current liabilities 20 17 18
Total liabilities and equity 223 234 226
Net IB debt 2 -34 -20
Net IB debt excl. pension debt 2 -34 -20
Net IB debt excl. leasing 2 -34 -20
Capital employed 182 195 186
Capital invested 159 140 145
Working capital 87 68 72
Market cap. diluted (m) 101 111 111
Net IB debt adj. 2 -34 -20
Market value of minority 0 0 0
Reversal of shares and participations -24 -24 -24
Reversal of conv. debt assumed equity N/A N/A N/A
EV 103 77 90
Total assets turnover (%) 79,5 87,9 94,5
Working capital/sales (%) 49,4 38,6 32,4
Financial risk and debt service N/A N/A N/A
Year N/A N/A N/A
Net debt/equity (%) 1 -19,4 -12,3
Net debt / market cap (%) 1,6 -30,5 -18,4
Equity ratio (%) 70,5 74,1 73
Net IB debt adj. / equity (%) 1 -19,4 -12,3
Current ratio 2,41 2,84 2,67
EBITDA/net interest 21,5 18,6 4,8
Net IB debt/EBITDA (x) -0,1 -2,5 -6,3
Net IB debt/EBITDA lease adj. (x) -0,1 -2,5 -6,3
Interest coverage 33,4 0,3 11,7
SEKm 2025 2026e 2027e
Shares outstanding adj. 7 7 7
Diluted shares adj. 7 7 7
EPS -3,47 -0,07 -1,18
Dividend per share 0 0 0
EPS adj. -3,47 -0,07 -1,18
BVPS 23,87 24,15 22,97
BVPS adj. 16,82 17,82 16,8
Net IB debt/share 0,25 -4,69 -2,84
Share price 15,4 15,4 15,4
Market cap. (m) 101 111 111
P/E (x) N/A N/A N/A
EV/sales (x) 0,6 0,4 0,4
EV/EBITDA (x) -7,2 5,8 28
EV/EBITA (x) -4,6 373,1 -11,6
EV/EBIT (x) -4,6 373,1 -11,6
Dividend yield (%) 0 0 0
FCF yield (%) -32,1 16,9 -12,1
Le. adj. FCF yld. (%) -32,1 16,9 -12,1
P/BVPS (x) 0,65 0,64 0,67
P/BVPS adj. (x) 0,92 0,86 0,92
P/E adj. (x) N/A N/A N/A
EV/EBITDA adj. (x) -7,2 5,8 28
EV/EBITA adj. (x) -4,6 373,1 -11,6
EV/EBIT adj. (x) -4,6 373,1 -11,6
EV/CE (x) 0,6 0,4 0,5
Investment ratios N/A N/A N/A
Year N/A N/A N/A
Capex/sales (%) 7,4 6,1 5,5
Capex/depreciation 1,8 0,9 1,1
Capex tangibles / tangible fixed assets 7,1 5,1 36,2
Capex intangibles / definite intangibles 29,2 26,5 22,1
Depreciation on intang / def. intang 17 28,8 24,6
Depreciation on tangibles / tangibles 0 0 1,7

Equity research

Read earlier research

Media

ES Energy Save - Company presentation with CEO Yibo Zhao & Chairman of the Board Fredrik Sävenstrand
Energy Save - Company presentation with CEO Fredrik Sävenstrand & CFO Helena Wachtmeister

Main shareholders - Energy Save

Main shareholders Share capital % Voting shares % Verified
Project Air AB 13.4 % 35.7 % 28 Oct 2026
Christian Gulbrandsen 12.4 % 35.3 % 28 Sep 2026
Theodor Jeansson Jr. 8.3 % 3.3 % 28 Oct 2026
Nordea Funds 6.7 % 2.6 % 28 Oct 2026
Avanza Pension 5.9 % 2.3 % 28 Oct 2026
Lommen Invest 2.6 % 1.0 % 28 Oct 2026
Henrik Nilsson 2.5 % 1.0 % 28 Oct 2026
Bo Westerberg 1.9 % 0.8 % 28 Oct 2026
Nordea Liv & Pension 1.8 % 0.7 % 28 Oct 2026
Linus Åke Fredrik Lindström 1.7 % 0.7 % 28 Oct 2026
Source: Holdings by Modular Finance AB